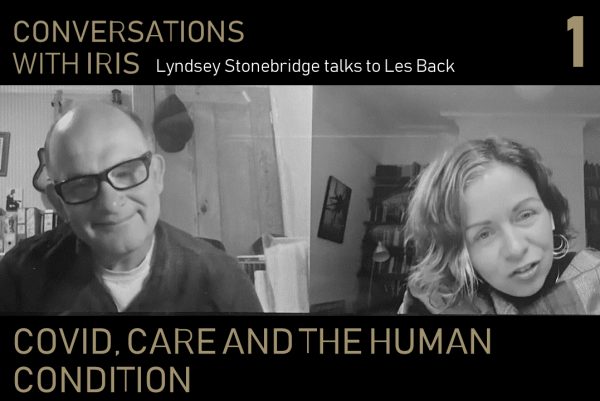
In the shadow of Brexit: Portraits of EU families in London

This photo project is part of the EU families and their children in Brexiting Britain: renegotiating inclusion, citizenship and belonging’s study, funded by the Economic and Social Research Council (ESRC) and The UK in a Changing Europe Initiative. The overall research investigates how families with EU27 parents are managing the change and uncertainty brought by the referendum, and... Continue Reading →

The tower: Diary of an EU citizen in the UK (26)

The Grenfell Tower is a microcosm of London’s superdiversity and income inequality.

Postcards from ...

London’s burning, London’s burning.

Fetch the engines, fetch the engines.

Fire fire, Fire Fire!

Pour on water, pour on water.

My son is in Year 1, last term the 1666 fire of London was the core theme of his school activities – he made dramatic fire-related artwork, he learned about fire and wood houses, firefighters and the pain of those who survived. They were read passages of Samuel Pepys diary. He asked a thousand questions. He wanted to know if our home is safe. In his school diary he wrote: People were fleeing like meerkats; the flames were like dolphins jumping on a flat sea. He sang and sang this song.

How do I tell my son, how do we tell our children that in 2017 London is burning again? How can we explain to a 6-year- old that someone like him in London had half of his classmates vanished…

View original post 578 more words

Servicing super-diversity

Excellent piece by Ben Gidley originally published in COMPAS blog on a pilot research project exploring patterns and layering of diversity in Elephant & Castle

171bus

This is my latest COMPAS blog post. You can read the original here. The photos are by me.

In the 1890s, philanthropist Charles Booth and a team of assistants – the pioneers of sociological research in the UK – walked the whole of London, visually noting the wealth of each street’s inhabitants, to construct their Maps Descriptive of London Poverty. The maps coded streets by colour, with scarlet red and gold marking the “well-to-do” and the “wealthy”, dark blue and black representing the “casual poor” in “chronic want” and the
“vicious and semi-criminal” “lowest class”. Southwark, just across the Thames from the City of London, was a mass of dark colours.

A hundred years later, the New Labour government created an Index of Multiple Deprivation to map new forms of poverty, dark blue for most deprived and gold for least. Again, the northern wards of Southwark were swathed…

View original post 1,062 more words

Blog at WordPress.com.

Up ↑